Spark: Opportunity Cost - how did it go?
“What’s a decision you made recently where you didn’t think about the opportunity cost — and regretted it?”
“Is opportunity cost always obvious? Can it sometimes sneak up on you?”
“Do you think adults are better at thinking about opportunity cost than teens? Why or why not?”
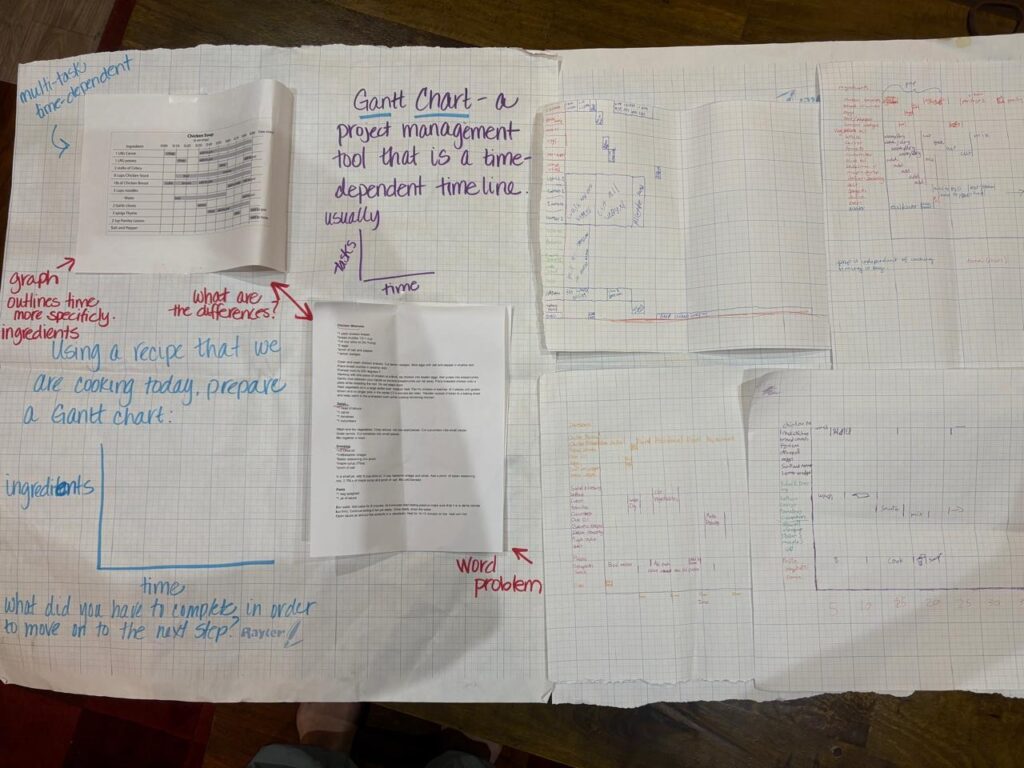
Objective: To understand what is a Gantt Chart and then to be able to draw one to map out our cooking plan.
Recipe - What is a Gantt Chart - How to draw one - Use the large paper…
A Gantt chart is a bar chart that shows a project schedule. We will use one to figure out timing for our recipes today.
We will make the chart and then discuss and then cook and see how it goes!
Share this link with your friends.


Amy J.
September 25, 2025
A day after we made dinner together and it was a success. We all made a Gantt chart – and I added it to the update at the top with a photo. We had all the tools necessary – the recipes – graph paper – different color pens. I think I could have explained the idea of a Gantt chart better, more thoroughly, but they had the example and we talked about the different elements that we were going to graph, time, steps and ingredients. Because we took the time to understand what we were going to do, and how we were going to do it – we were very prepared. We had different views about how long it was going to take – from 20 minutes to 1 hour. It took 1 hour. However, it probably wouldn’t have taken that long if we hadn’t put the pot on the wrong burner so the water didn’t boil in the 8 minutes that we calculated. The food was good and everyone ate a lot! I think that next week, I will actually give a case study with a Gantt chart for the boys to do, to make sure that I solidify the understanding. And we can discuss case study assessments as well. Then I think we will write a mission statement for our little group. I am still thinking about next week.